via ARTBA
Each year, the American Road & Transportation Builders Association (ARTBA) puts out their annual Bridge Report, which highlights the general state of America’s bridges. Their recently released 2020 report shows that we’re making progress on the structurally deficient bridges across the country, but the association is not satisfied with the speed of repairs.
There are currently 617.049 bridges in the US (up from 616,087 in the previous year), according to the ARTBA report and 46,155 of them have been rated as “structurally deficient,” which is down from last year’s total of 47,052. The term signifies that there are “one or more structural defects that require attention.”
At the current rate, the ARTBA says that repairing every structurally deficient bridge in the US would take 50 years.
Including the 46K+ bridges listed as structurally deficient, there are over 231,000 bridges that have been identified as needing repaired, amounting to roughly 37% of the total fleet, a 1% reduction versus last year.
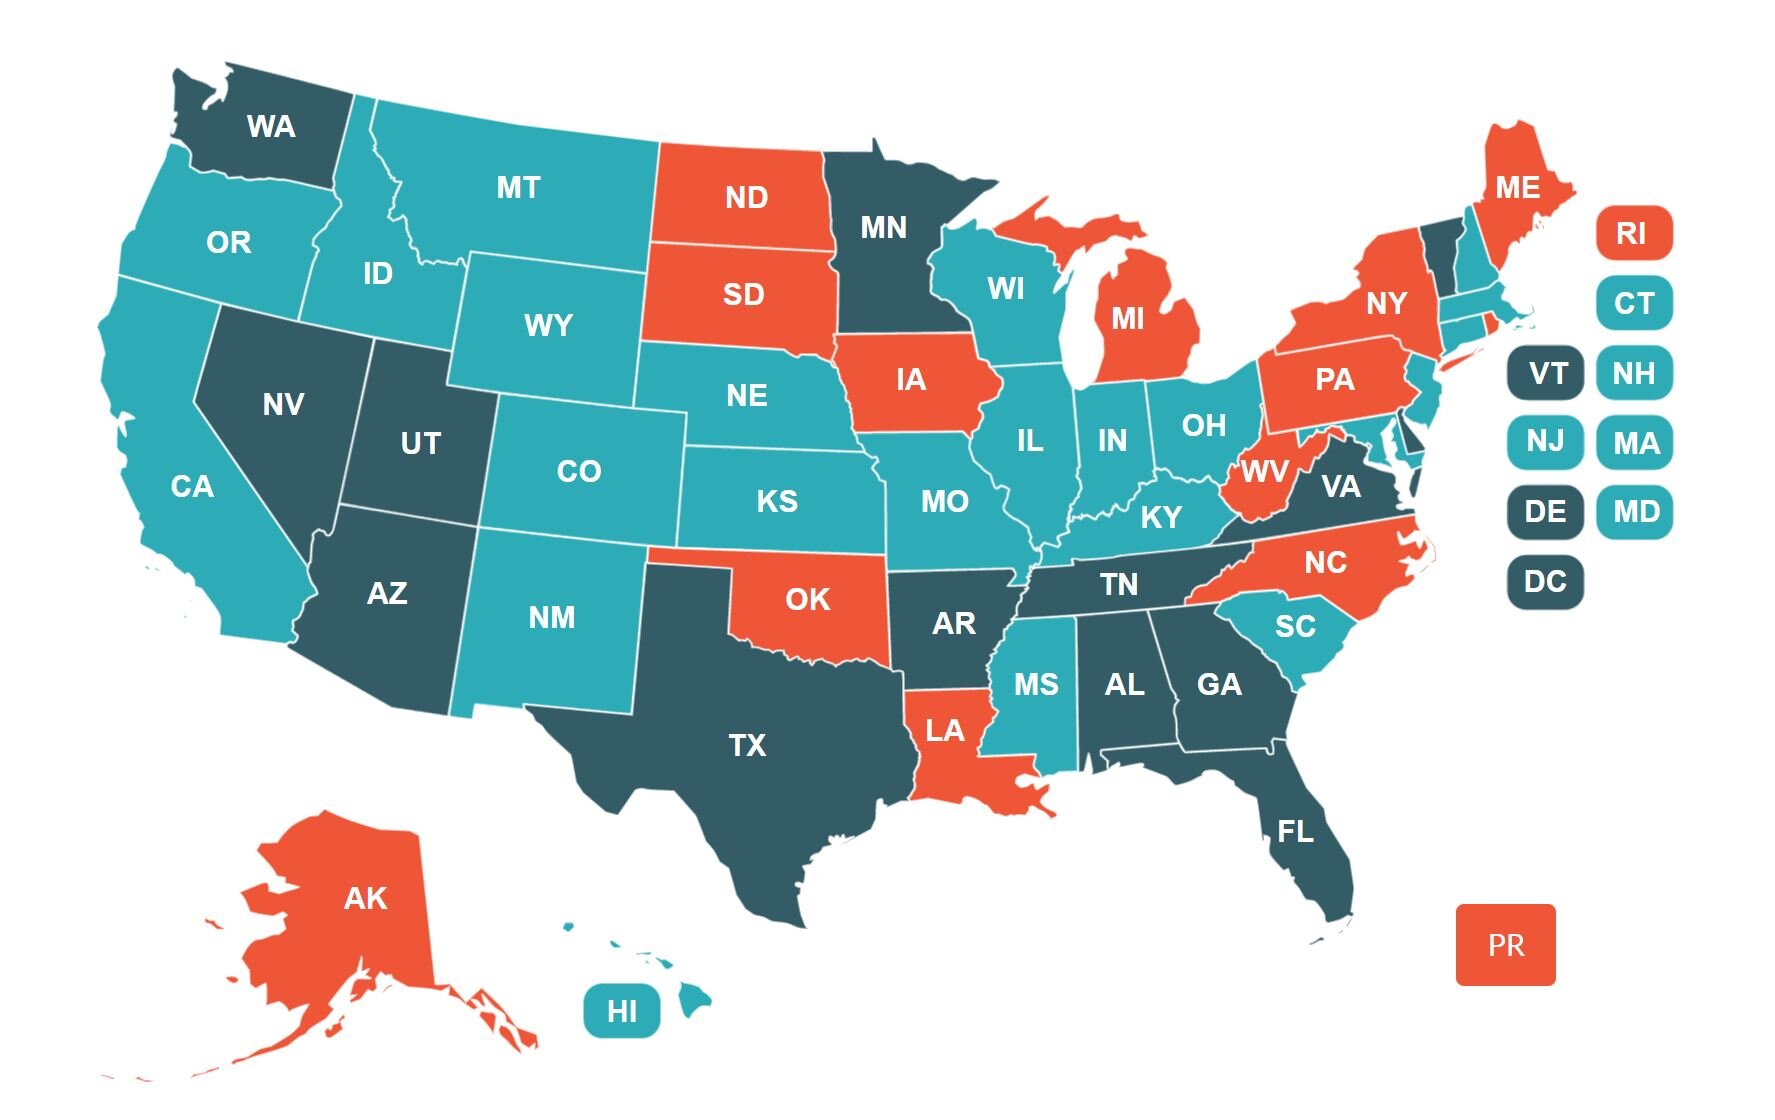
The states with the most structurally deficient bridges are:
1. Iowa – 4,575 (ranked #1 last year)
2. Pennsylvania – 3,501 (ranked #2 last year)
3. Illinois – 2,407 (ranked #4 last year)
4. Oklahoma – 2,352 (ranked #3 last year)
5. Missouri – 2,147 (ranked #5 last year)
The states with the highest percentage of structurally deficient bridges are:
1. Rhode Island – 22.3% (ranked #1 last year)
2. West Virginia – 21% (ranked #2 last year)
3. Iowa – 19% (ranked #3 last year)
4. South Dakota – 17% (ranked #4 last year)
5. Pennsylvania – 15.3% (ranked #5 last year)
ARTBA has also released an interactive state map (screenshot of the map is above), if you’d like more information on the problematic bridges in your area. You can access that map on ARTBA's website by clicking or tapping here


Shane is the creator of Construction Junkie and an active construction project manager. In his career, he has managed interior remodel projects, site development, construction safety, governmental project compliance, and facility maintenance. He has a strong passion for construction technology and safety, as well as sharing the knowledge or insights he has gained throughout his career.