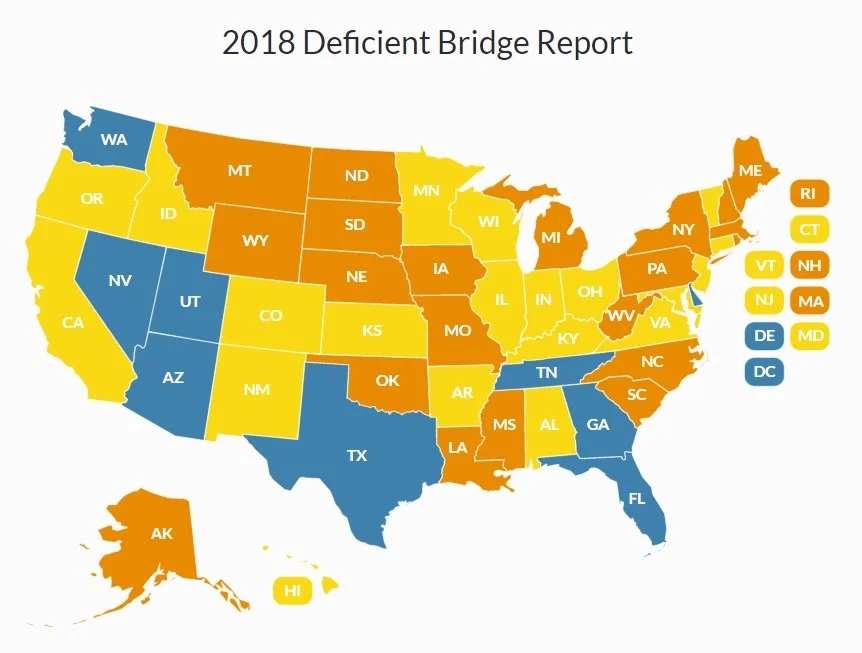
via ARTBA
With over 612,000 bridges across the United States a large emphasis must be placed on maintaining and replacing them each year. We’ve been hearing the narrative surrounding “America’s failing infrastructure” for several years now, but there’s still a lot of progress to be made.
In President Trump’s recent State of the Union Address, he again emphasized a push for $1.5 trillion in investments for infrastructure. Whether or not that amount of money actually gets spent on our roads, highways, and bridges remains to be seen, but the announcement has many in the construction industry applauding the focus.
So what actually needs to be fixed in this country? According to a new report from the American Road and Transportation Builders Association (ARTBA), there are currently 54,259 of the country’s 612,677 bridges that are rated “structurally deficient.” The term signifies that there are “one or more structural defects that require attention.” A total of 226,837, or 37%, of the bridges also have repair needs that have been identified.
In 2016, there were a reported 55,710 bridges that were rated structurally deficient, so there’s only been a modest improvement since that time. At the current pace, the ARTBA estimates that it would take 37 years to fix all of the problematic bridges. The group also estimates that the trucking industry alone loses $60 billion per year due to lost productivity and fuel caused by traffic bottlenecks.
The states with the most structurally deficient bridges are:
1. Iowa – 5,067
2. Pennsylvania – 4,173
3. Oklahoma – 3,234
4. Missouri – 3,086
5. Illinois – 2,303
The states with the highest percentage of structurally deficient bridges are:
1. Rhode Island – 23%
2. Iowa – 21%
3. West Virginia – 19%
4. South Dakota – 19%
5. Pennsylvania – 18%
Washington DC (8), Nevada (31), Delaware (39), Hawaii (66), and Utah (87) have the least amount of deficient bridges on the list.
ARTBA has also released an interactive state map (screenshot of the map is above), if you’d like more information on the problematic bridges in your area. You can access that map on ARTBA's website by clicking here


In the midst of fierce discourse over the bipartisan infrastructure bill lies a unique opportunity for the United States.